The Reporter Express
In our September 1, 2017 issue of The Reporter about equity and bond risk, we looked at the following question:
Which asset class is riskier, stocks or bonds?
The answer seems obvious, right?
On a long-term investment horizon, stocks usually generate a higher return than bonds. However, to reach this objective, investors must deal with greater price volatility.
To compensate for the additional risk that holding stocks entails, investors expect a higher return. This is called a risk premium. When choosing whether to put their money in stocks or bonds, investors calculate the risk premium to pick the asset class that offers the best trade-off between risk and return over a given investment horizon. It's important to bear in mind that there's an inverse relationship between the interest rate on a fixed-income security and its price.
We calculated the risk premium at the time and our conclusions were clear: bonds were riskier than stocks. Here's an excerpt from our observations:
"Sooner or later, we believe that inflationary pressure will emerge and inevitably put upward pressure on interest rates, which will result in significantly less favourable conditions for the bond market."
As you know, the economic landscape has changed considerably these past few years, and this has led us to reassess the relevance of risk premiums when determining the asset allocation within the Balanced Tax Efficient portfolio. This portfolio contains cash, bonds, preferred shares and common shares.
Comparing apples to apples
Six years ago, we used the Fed Stock Valuation Model to compare stocks and bonds. Today, we're taking a similar approach by first calculating the expected return based on stock market valuations. We do this by taking the price-to-earnings ratio for the S&P 500 (20), and then calculating the reciprocal of that number (1/20) to determine the earnings yield. We then apply that percentage to the US 10-year interest rate (4.35%) to get a risk premium of 0.65%.
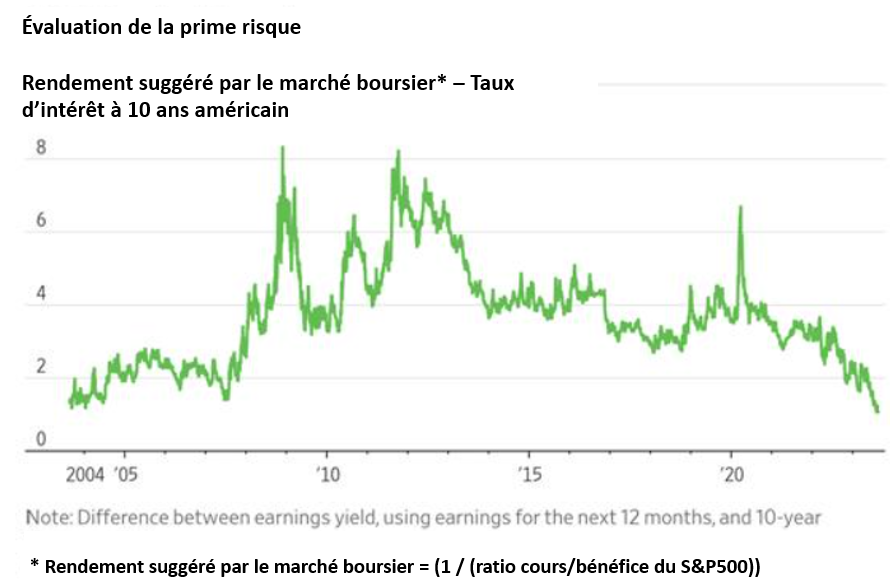
The chart below illustrates that the risk premium is now at a 20-year low, which suggests that stocks are less appealing than bonds right now.

The higher the risk premium, the more we should prioritize stocks in the asset allocation for the Balanced Tax Efficient portfolio. Let's take a look at the 2021 risk premium. Even though the expected return wasn't as high as it is now (4.5% vs. 5%) due to a higher price-to-earnings ratio for the S&P 500 (22 vs. 20), the US 10-year interest rate was significantly lower (1% vs. 4.35%). Consequently, the 3.5% risk premium encouraged us to weight equities more heavily, which we obviously did.
| Price-to-earnings ratio | Return suggested by the stock market (1 / Price-to-earnings ratio)) (A) | (A) US-10-year interest rate | Risk premium | |
|---|---|---|---|---|
| 2021 | 22 | (1/22) = 4.5% | 4.5% - 1% = | 3,50% |
| August 2023 | 20 | (1/20) – 5% | 5% - 4,35%= | 0,65% |
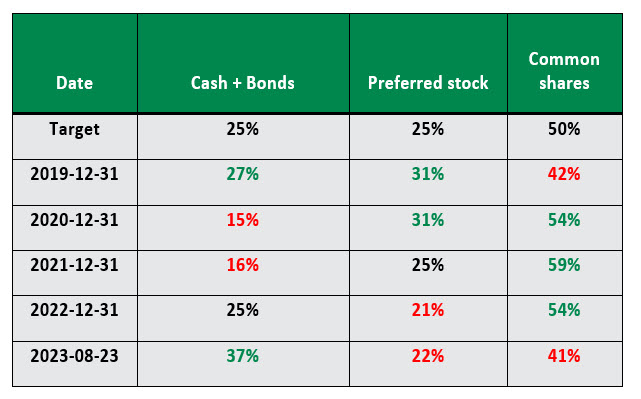
The table below shows the Balanced Tax Efficient portfolio's asset allocation since the end of 2019. Although our investment policy sets out target allocations for the various asset classes, we are able to change their weightings to add value based on the current risk premium. This explains why equities are so heavily weighted (59%) at the end of 2021 and, in turn, why the allocation to cash and bonds is so much lighter (16%).

As of August 23, 2023, based on the current risk premium (0.65%), we're gearing up for the pendulum to possibly swing back toward bonds. The portfolio's allocation to equity is 41%—9% lower than the 50% target. Once again, our ultimate goal is to preserve your capital, hence our focus on risk vs. return. Because of this, you'll notice a number of changes to your account statements as a direct result of some rebalancing transactions. Please note that you'll soon be receiving another issue of The Reporter with a trade confirmation for the purchase of Pfizer and Verizon Communications shares.
Each Desjardins Securities advisor named on the front page of this document, or at the beginning of any subsection hereof, hereby certifies that the recommendations and opinions expressed herein accurately reflect such advisor’s personal views about the company and securities that are the subject of this publication and all other companies and securities mentioned in this publication that are covered by such advisor. Desjardins Securities may have previously published other opinions, including ones contrary to those expressed herein. Such opinions reflect the different points of view, assumptions and analysis methods of the advisors who authored them. Before making an investment decision on the basis of any recommendation made in this document, the recipient should consider whether such recommendation is appropriate, given the recipient’s particular investment needs, objectives and financial circumstances.

